The Tool Box
The Tool Box
# Import libraries import os import pandas as pd import numpy as np #import csv import pathlib #from collections import Counter #import matplotlib.pyplot as plt #import pyodbc from datetime import datetime import timeit import re from string import punctuation import unidecode import ast # Ignore some warnings import warnings warnings.simplefilter(action='ignore', category=FutureWarning) pd.options.mode.chained_assignment = None # ignore SettingWithCopyWarning # Progression's check tool from tqdm import tqdm, tqdm_notebook tqdm_notebook().pandas() # Custom pd.set_option('display.max_rows', 500) pd.set_option('display.max_columns', 500) # pd.set_option('display.max_colwidth', -1) # Multi print import from IPython.core.interactiveshell import InteractiveShell InteractiveShell.ast_node_interactivity = "all"
# System informations import os import platform from platform import python_version import jupyterlab import numpy as np import pandas as pd print("System") print("os name: %s" % os.name) print("system: %s" % platform.system()) print("release: %s" % platform.release()) print() print("Python") print("version: %s" % python_version()) print() print("Python Packages") print("jupterlab==%s" % jupyterlab.__version__) print("pandas==%s" % pd.__version__) print("numpy==%s" % np.__version__)
# SQL Conenction conn = pyodbc.connect('DSN=my_DB;UID=my_user;PWD=my_password') # Extract data df = pd.io.sql.read_sql("SELECT * FROM YOUR_TABLE", conn)
# Import libraries import os import pandas as pd import numpy as np #import csv import pathlib #from collections import Counter #import matplotlib.pyplot as plt #import pyodbc from datetime import datetime import timeit import re from string import punctuation import unidecode import ast # Ignore some warnings import warnings warnings.simplefilter(action='ignore', category=FutureWarning) pd.options.mode.chained_assignment = None # ignore SettingWithCopyWarning # Progression's check tool from tqdm import tqdm, tqdm_notebook tqdm_notebook().pandas() # Custom pd.set_option('display.max_rows', 500) pd.set_option('display.max_columns', 500) # pd.set_option('display.max_colwidth', -1) # Multi print import from IPython.core.interactiveshell import InteractiveShell InteractiveShell.ast_node_interactivity = "all"
This code contains two functions : Overview plot & Overview table. I published the code on GitHub and on Kaggle. Feel free to use it, upvote if you like it, and share yours ! 🙂
—
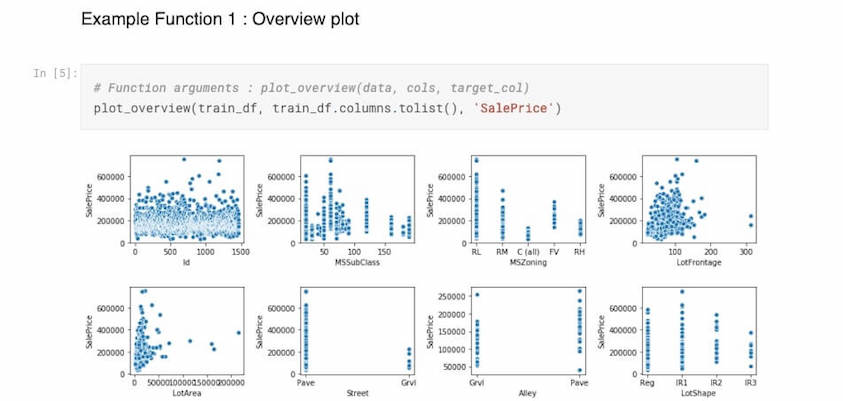
Overview plot : The first displays the correlation of the dataset variables with your target variable. In my example SalePrice of houses, from Kaggle dataset.
—
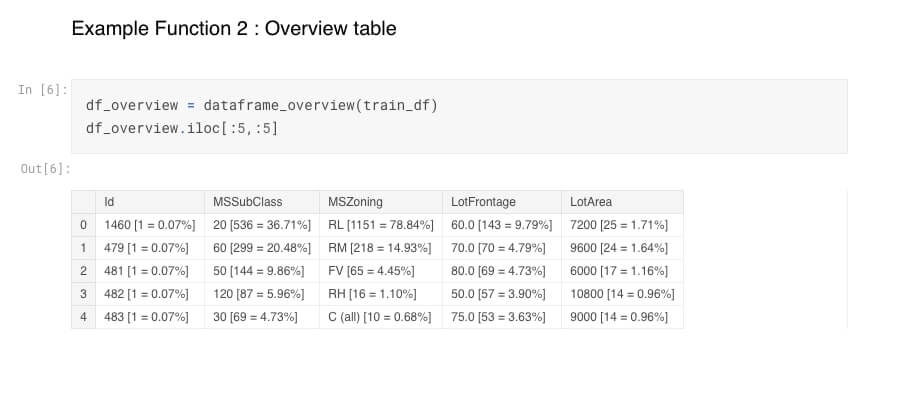
Overview table : The second function displays the different values existing in each of the columns. For exemple third row first column, RL [1151 = 78,84%], where RL is the value, 1151 its occurence and 78,84% its percentage.
How to systematically remove collinear variables in Python?
Source : stats.stackexchange.com
—
This checks VIF values and then drops variables whose VIF is more than 5.
from statsmodels.stats.outliers_influence import variance_inflation_factor def calculate_vif_(X, thresh=5.0): variables = list(range(X.shape[1])) dropped = True while dropped: dropped = False vif = [variance_inflation_factor(X.iloc[:, variables].values, ix) for ix in range(X.iloc[:, variables].shape[1])] maxloc = vif.index(max(vif)) if max(vif) > thresh: print('dropping \'' + X.iloc[:, variables].columns[maxloc] + '\' at index: ' + str(maxloc)) del variables[maxloc] dropped = True print('Remaining variables:') print(X.columns[variables]) return X.iloc[:, variables]
Regression : linear regression, Support Vector Regression (SVR), and regression trees
Classification : logistic regression, Naïve Bayes, decision trees, and K Nearest Neighbors, Decision trees, kernel approximation
https://www.kdnuggets.com/2016/08/10-algorithms-machine-learning-engineers.html/2
The 10 Best Machine Learning Algorithms for Data Science Beginners
https://analyticstraining.com/popular-regression-algorithms-ml/
https://www.analyticsindiamag.com/top-6-regression-algorithms-used-data-mining-applications-industry/
https://scikit-learn.org/stable/supervised_learning.html
Jupyter notebook offers possibilities as wide as unsuspected. Here is a compliation of links to articles that deal with this subject :
Executing shell commands, splitting notebook cells, collapsing heading, Qgrid (dynamic table as Excel), Slide shows (fixed, or interactive), embedding contents (url, pdf, youtube video, etc), or interactive widgets :
Environment switching, plus a list of 9 useful extensions, but without examples:
• https://towardsdatascience.com/supercharging-jupyter-notebooks-e22f5ad7ca18
Profile report of a dataframe, interactive plot with plotly, and useful magic commands:
• https://www.kdnuggets.com/2019/07/10-simple-hacks-speed-data-analysis-python.html
Variable inspector, execute time, hide code input:
• https://towardsdatascience.com/jupyter-notebook-extensions-517fa69d2231
Notify, code folding, debug:
• https://ndres.me/post/best-jupyter-notebook-extensions/
Much more to explore here:
• https://github.com/markusschanta/awesome-jupyter
Qgrid demo and more:
• https://github.com/quantopian/qgrid
Unofficial Jupyter Notebook Extensions page:
• https://jupyter-contrib-nbextensions.readthedocs.io/en/latest/
GroupBy, Numpy, Pandas, Matplotlib, Seaborn, Bokeh, Dash, Scikit-Learn, Keras, Template, NLK, Spyder, Jupyter, Panel, Tableau, GRETL, statistics, formula, CAP, ROC, AUC, MSE, R2, Adjust r2, t-student, p-value, chi-squared, z-test, F1 Score, Clustering, association rule, Classification, Regression, Bayes, Github, dimensionality reduction, Monte Carlo, statsmodel, sampling, scaling, cross validation, distribution,
https://www.kdnuggets.com/2016/08/10-algorithms-machine-learning-engineers.html/2
https://www.alooma.com/blog/top-data-science-tools
http://sux13.github.io/DataScienceSpCourseNotes/ (R)
http://blog.datadive.net/7-tools-in-every-data-scientists-toolbox/